Ok so I went evangelical last week and made a fool of myself without posting any proof that I have been, yes, trend trading.
So here it is. The newest intraday trend method.
Pay close attention because this is a pretty powerful method.
First and foremost, you have to trade with constant range bars. Do not even think that this will work as well on a standard intraday chart. You will get chopped to bits and blast me as a system serialist. Which I probably am, but this is really not the case this time.
Second you need two ways to mark the intermediate trend. I have chosen Supertrend and a rather quirky rsi like indicator named after its creator the YangTraderMain.
The settings I use on the constant range bars are based on a 24 hour ADR rating (Average daily range). For example, EUR/GBP had a range of about 97 pips yesterday. if you divide 97 by 24 you get almost 5 pips an hour. So I would trade EUR/GBP with 5 pip constant range bar.
The settings on Supertrend are 10 period and the multiplier 1.5. This is very similar to an ATR rating but there is some updated voodoo. This is probably one of the most popular revisions on the moving average crossover because it integrates the crossover with a measure of volatility. Which is pretty much the foundation for robust trend trading methods.
The bars should be set on OHLC not candlestick. This is extremely important to determine entry and stops. The stop method employed here is a huge advantage over any other stop method I have attempted before.
Since it's so important, let's start with stops then.
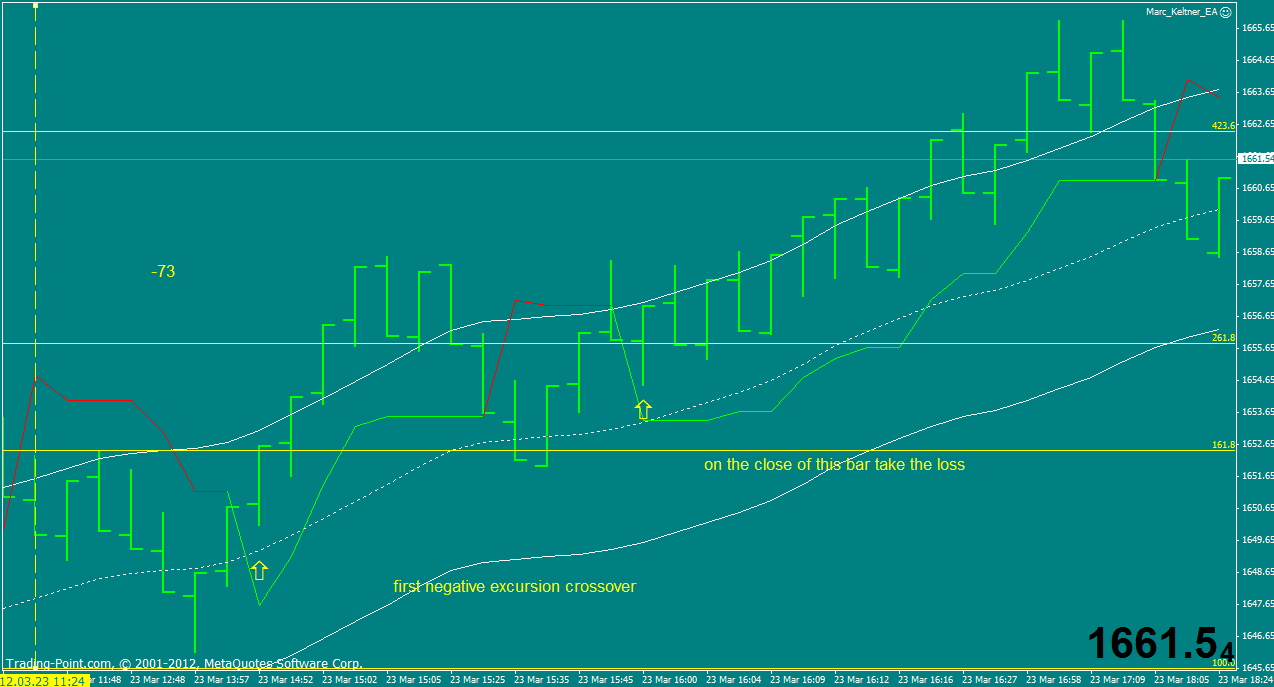
Take the swing high prior to the signal and place a horizontal line 1 pip beyond this level. If price trades at this level AND BEYOND. Do not exit. Not yet. Wait. Yes, wait. Wait for a OHLC bar to CLOSE outside this horizontal line. Occasionally a bar will OPEN outside this level but it will trade back into the range. This is the precisely why this stop method is so useful. It allows you to take a slightly larger loss by waiting to see if the market makers are simply blowing stops and mean reverting or if the market has really broken out. I should mention that this stop method is extremely risky using time based bars. A close of a time based bar gives you no measure of volatility. A 5 minute bar could be 1 pip or, as in the case of EUR/CHF a few weeks ago HUNDREDS!
 |
| This is only a few trades. I still cannot get over how well AUD/JPY trends. The range is phenomenal. Yesterday it signaled for more than 175 pips and still going. Sweet Moses! |
Entries are a much tamer affair and probably familiar to most trend traders. Price should close in the direction of the Supertrend indicator. The price bar should also close in the direction of the supertrend. In addition, the yang trader must be signalling with the trend as well.
I particularly like the staggered effect that Yang trader creates. There are quite a few signals which you should not even consider taking. Think of them more like a divergence indicator than a directional indicator. Once all 3 of these factors are in sync, a trade should be entered.
Now, normally we would use targets. But with trend trading, there are so many reasons why we shouldn't trade in this manner. There is just so much profit to be made in the trades you EXPECT to reverse at 20 pips and they drip drip drrrrrrrrrrrrrrip on for another 100 leaving you to do nothing but bank pips the whole session. This is the ONLY part of trading which gives you an edge. Predictive methods just cannot compare to this kind of trading. They will lose over the long term if left on their own. I should mention something that I have felt for quite a while. I honestly believe Fibonacci, Gann, MurreyMath, Astrology, etc. work well. BUT they do not work because of some
secret order to the universe. They simply work for the same reason that trend trading fails for short periods of time. Markets revert to the mean. Randomly mark horizontal lines on a chart and trade your method based on them. I have discovered that for a short period of time, they will outperform almost any world famous support and resistance level. This includes daily pivot points. This is not a knock on support and resistance trading, it is just a fact and it still justifies trading in this method, but trend trading just makes more money over the long term.
So we trail our entries.
The trailing stop, at least for now, until I find something more ideal, will be the pip difference between the swing high and the entry.
That's it.
I would recommend you trade the less volatile pairs at the beginning. This system needs to be watched for the stops as we cannot enter a firm price in the market. But once you are in profit, just walk away and wait for the next Supertrend crossover.
This week profits have been good if not great. I made about 350 pips on 4 pairs. Maximum price excursion was running at about 45% of gains. That is, prices went against me about half as much as profits. This is primarily due to a few big trends on Monday. I would expect this to revert more towards a negative mean over time. Mainly because we are trailing exits. The frequency of small gains will outweigh the occasional meaty loss.
Good trading.