Current Positions:
Short EUR/USD 1.2613 or higher
Short GBP/USD 1.6039 or higher
Short AUD/USD .8738 or higher
Short XAU/USD 1204.34 or higher
Long USD/CHF .9614 or lower
Closed Positions:
Buy EUR/AUD 1.4400 stopped breakeven
*Stops are based on the previous swing high or low prior to the signal and require an hourly close above or below this swing high or low; they are not based on a strict price.
Showing posts with label supertrend. Show all posts
Showing posts with label supertrend. Show all posts
Tuesday, October 7, 2014


Friday, September 19, 2014
September has returned with welcome volatility
After what has been a shockingly sludgy market, September has seen volatility expansion to the Forex markets with a bang.
Here are the pip totals so far with 2 weeks of trading said and done.
EUR/USD no trades
GBP/USD +212
AUD/USD +114
EUR/JPY +171
GBP/JPY +198
USD/CAD +32
XAU/USD +231
OIL +272
Most gains were primarily set up on Tuesday the 16th, which was a FED speaking day. It's encouraging to see that the FED announcements are once again causing markets to move.
*Please note, all trades are taken off the meantrades hourly system applying a daily supertrend filter to determine which trades to exclude and which trades to take.
**No position sizing modifications were made for these pip totals. If one were to consider position sizing modification, the first trade after the daily supertrend filter would be a full sized position while each additional trade taken in the same direction as the established daily supertrend would be a half size position. This is necessary in a low volatility environment where waiting for the supertrend cross to exit would create extremely small gains as the price behavior in such an environment, contrary to expectations, does not trend well at all. It is in the truest sense of the word, a mean reverting environment.
Here are the pip totals so far with 2 weeks of trading said and done.
EUR/USD no trades
GBP/USD +212
AUD/USD +114
EUR/JPY +171
GBP/JPY +198
USD/CAD +32
XAU/USD +231
OIL +272
Most gains were primarily set up on Tuesday the 16th, which was a FED speaking day. It's encouraging to see that the FED announcements are once again causing markets to move.
*Please note, all trades are taken off the meantrades hourly system applying a daily supertrend filter to determine which trades to exclude and which trades to take.
**No position sizing modifications were made for these pip totals. If one were to consider position sizing modification, the first trade after the daily supertrend filter would be a full sized position while each additional trade taken in the same direction as the established daily supertrend would be a half size position. This is necessary in a low volatility environment where waiting for the supertrend cross to exit would create extremely small gains as the price behavior in such an environment, contrary to expectations, does not trend well at all. It is in the truest sense of the word, a mean reverting environment.
Thursday, September 6, 2012
Keeping the switch on
Looking back at the previous post so many months ago I am pleasantly surprised at how much my attitude towards automation has changed. Since the end of June I have been on an automated version of my system and the results have been nothing if not impressive. Some takeaways over the past few months in my transition from mechanical manual trading to automation include:


- Accepting drawdowns with a more passive attitude. The roll-out of the EA conincided with a technically poor Forex market. There was no volatility or serious volume coming into the market this summer--which is to be expected with many large traders off for the summer months. However I kept the controls on and sat passively while the system took it's lumps. It was perhaps the first time ever in my trading career where I allowed my account equity to drop without any attempt at hedging or removing stops. Ironically I feel I have grown as a trader by becoming less involved in my actual trades.

- Having a healthy expectancy. By knowing how meantrades has performed in the past, keeping the switch on during drawdowns enables me to avoid missing the huge upswings in account equity. At the moment my expectancy is only around 1.3 for every dollar risked. Most long term systems tend to float around 1.5 to 2 for really huge returns. There are a few considerations on the lower expectancy such as trailing supertrend exits too closely during flattening volatility in the Asian session. Widening the supertrend stop as well as taking Friday afternoons off are two of the ideas I am toying with currently. Generally speaking though, 1.3 is enough for things to get very interesting in the long term. Currently meantrades is running at about 60% accuracy on the 3 markets I am trading everyday (those are EUR/USD, GBP/USD and the cfd for oil). I am thinking like a trend trader on this matter and would probably like to tighten the stops more, reduce the drawdown and get larger returns less frequently. All in due course. For now it's about keeping the switch on and maintaining a healthy expectancy.
Wednesday, May 23, 2012
Weekly Meantrades
The past few weeks have been nothing short of frustrating. Automation with constant range bars on Metatrader 4 seems futile. With a single disconnect from the brokers server, the constant range bars are immediately scrambled and thus any reversal patterns are suspect. Somehow this had me thinking about how I can get this very decent system called meantrades running without a hitch. I came up with a version which uses 240 minute and 60 minute bars.
The only major difference (there is one minor variation however) between this system and the constant range bars version is that it is restricted to only 1 profitable trade a week. "Profitable trade" as in it will enter up to 2 unprofitable trades in the same direction per week. This is similar to the intraday meantrades which only takes two consecutive unprofitable intra-day trades in the same direction.
The results thus far are quite respectable. Considering the time invested versus return on capital, the weekly version of meantrades is a better deal for smoothing out the all important equity curve.
I realize these numbers probably seem absurdly high and I am just as skeptical as anyone else would be. But it's been backtested for several years and all trades are based on a closed bar basis so it is pretty hard to fudge the results.
Currently the XAU/USD weekly version of meantrades is running at 75% for the year with a total of 698 pips employing a trailing stop. With a fixed 100 pip target it's coming in at 871 pips. Let's say we are in June already, since we cannot take another trade until next week, that is a very tough return to beat of 145 pips per month trading no more than 1 winning trade per week.
The results for the EUR/USD market are also quite respectable. Coming in at 69% for the year trading only once a week the supertrend exit works out to 963 pips thus far while a fixed exit of 63 pips has yielded a return of 335 pips. Winning percentage is based on a total of 26 trades so far this year.
I initially set out on this discovery using the AUD/USD. My thinking was that somehow if I ever got around to getting meantrades automated I should probably try it out first on some less volatile pairs. I have never traded AUD/USD seriously as it seems rather dull market. In fact it's almost as profitable as any other market I looked at. The results came in as follows: 70% winners out of 27 trades taken. Most impressive are the drawdowns to achieve profitability. The market just seems to trend better than others when applying the lens of meantrades. Average losing trade was 67 pips while the average winning trade was 55 pips. This is the only serious issue for me trading less frequently. The average winner is normally larger than the average loser in a robust system. However when you are applying a trailing stop methodology for exits, the out sized returns of just a handful (or even a single yearly trade) can outpace the averages quite easily. As the Black Swan movement has attested to, the market does not reward those who seek the average return on equity as a benchmark, it obliterates them every few years with massive crashes and bubbles. I'm not a fund manager and I'm not seeking an average return so I will keep doing what I'm doing until something comes along which makes more sense.
For now, meantrades with trailing stops seems like the best way for me to trade these volatile and incredibly profitable markets for the foreseeable future.
Some of the inner workings for setting up the weekly meantrades method:

The only major difference (there is one minor variation however) between this system and the constant range bars version is that it is restricted to only 1 profitable trade a week. "Profitable trade" as in it will enter up to 2 unprofitable trades in the same direction per week. This is similar to the intraday meantrades which only takes two consecutive unprofitable intra-day trades in the same direction.
The results thus far are quite respectable. Considering the time invested versus return on capital, the weekly version of meantrades is a better deal for smoothing out the all important equity curve.
I realize these numbers probably seem absurdly high and I am just as skeptical as anyone else would be. But it's been backtested for several years and all trades are based on a closed bar basis so it is pretty hard to fudge the results.
Currently the XAU/USD weekly version of meantrades is running at 75% for the year with a total of 698 pips employing a trailing stop. With a fixed 100 pip target it's coming in at 871 pips. Let's say we are in June already, since we cannot take another trade until next week, that is a very tough return to beat of 145 pips per month trading no more than 1 winning trade per week.
The results for the EUR/USD market are also quite respectable. Coming in at 69% for the year trading only once a week the supertrend exit works out to 963 pips thus far while a fixed exit of 63 pips has yielded a return of 335 pips. Winning percentage is based on a total of 26 trades so far this year.
I initially set out on this discovery using the AUD/USD. My thinking was that somehow if I ever got around to getting meantrades automated I should probably try it out first on some less volatile pairs. I have never traded AUD/USD seriously as it seems rather dull market. In fact it's almost as profitable as any other market I looked at. The results came in as follows: 70% winners out of 27 trades taken. Most impressive are the drawdowns to achieve profitability. The market just seems to trend better than others when applying the lens of meantrades. Average losing trade was 67 pips while the average winning trade was 55 pips. This is the only serious issue for me trading less frequently. The average winner is normally larger than the average loser in a robust system. However when you are applying a trailing stop methodology for exits, the out sized returns of just a handful (or even a single yearly trade) can outpace the averages quite easily. As the Black Swan movement has attested to, the market does not reward those who seek the average return on equity as a benchmark, it obliterates them every few years with massive crashes and bubbles. I'm not a fund manager and I'm not seeking an average return so I will keep doing what I'm doing until something comes along which makes more sense.
For now, meantrades with trailing stops seems like the best way for me to trade these volatile and incredibly profitable markets for the foreseeable future.
Some of the inner workings for setting up the weekly meantrades method:
- The ratio levels need to be set off of the first 4 hour bar of the week or the second bar. This is slightly subjective in that I prefer to use the smaller of these two bars, unless it is just too small a range. In that case I will use the first 4 hour bar regardless of how large it is.
- Stops are usually an hourly close beyond the swing high of the trade entry. However in some cases this bar closes inside the Keltner bands (even though it is outside the highest high or lowest low for the trade setup). It is best not to take the loss until price has also violated the Keltner bands. There have been many cases where price makes a minor new high or low inside the Keltner bands only to reverse immediately.
Here is the only trade currently open with Weekly meantrades. An EUR/USD short currently sitting at +110pips. Stops are already at break even since price has already touched the opposite Keltner band from where the trade originated (as per the original rules of meantrades).

Wednesday, April 4, 2012
Trending or Ranging? Stops or Cost averaging? Zero loss trading? Wake the fuck up.
There are a few basic unanswerable questions in intraday trading. Is the market trending or ranging? Do I use hard stops or average in? Has the market volume dried up for the day? Only the left side of the chart can give any clues. I've tried at various times to achieve some semblance of a complete system. One which avoided the draw-downs necessary in institutional standard systems popular in the trading community but I have never succeeded in achieving any level of certainty about my trading.
Last week I modified one of my basic exit criteria from using swing high extreme price levels to relying on a very good but nonetheless, delayed indicator called "supertrend." This resulted in disaster for my account. Instead of having a fixed stop loss range in place (because fills can be dubious in the forex world), I was giving myself back to the fate of the markets. Huge fuck up. Markets don't "respect" indicators. They are just tools to help confirm what you are already positioning for. Once you let indicators decide your sole entry and exit you are fucked and feeble. That's not trading, that's more like tossing a chinese star in the air with your bare hands below it. A bad idea set in motion. Sometimes I wish I had a very close trading ally. Perhaps this is why most great traders don't actually pull the trigger, they have clerks who do the "dirty work" for them.
March was a decent month. I only traded 2 weeks but came out with a 20% return on equity. Very pleased. But then I went and messed with a sound risk metric, employing "supertrend" as a stop loss rather than simply a trailing stop. This caused me to give it all back to the market. Back to humble pie for me grandma.

In addition to battle tested methods of meantrade, I have always been focused on finding a way to trade ORB (opening range) breakouts on the same chart as reversals. I finally discovered that using a trailing indicator such as the cci, stochastics or rsi on a larger time frame as a directional indicator of the current market (yes, still a lagging metric but trends tend to persist in forex for at least a few hours which is all I need to take profits on a weekly basis) creates very robust breakout trading opportunities on my constant range charts. I have been using 10 pip ranges for both my EUR/USD and GBP/USD charts as of late as I find the market is as whippy as ever and the 20 crb's were giving back far too many pips.
I am now taking the pre-London range as my two trade levels (long and short). I only trade in the direction of the 4 hour indicator (in this case the 4hr reading of the CCI should be above the 0 level). The results are not bad. With this method it enables two trade opportunities per market per day. If the market breaks out I can enter at first break and if it pulls back to a trade level I am watching, I can enter for a nice reversion trade. Now I have both sides of a good market on my radar and on the same chart. This is somewhat encouraging for me as I was often sitting staring at the screen waiting for a meantrades setup to occur while the market just takes off without any retrenchments. Not a particularly useful way to trade the forex market these days.

Last week I modified one of my basic exit criteria from using swing high extreme price levels to relying on a very good but nonetheless, delayed indicator called "supertrend." This resulted in disaster for my account. Instead of having a fixed stop loss range in place (because fills can be dubious in the forex world), I was giving myself back to the fate of the markets. Huge fuck up. Markets don't "respect" indicators. They are just tools to help confirm what you are already positioning for. Once you let indicators decide your sole entry and exit you are fucked and feeble. That's not trading, that's more like tossing a chinese star in the air with your bare hands below it. A bad idea set in motion. Sometimes I wish I had a very close trading ally. Perhaps this is why most great traders don't actually pull the trigger, they have clerks who do the "dirty work" for them.
March was a decent month. I only traded 2 weeks but came out with a 20% return on equity. Very pleased. But then I went and messed with a sound risk metric, employing "supertrend" as a stop loss rather than simply a trailing stop. This caused me to give it all back to the market. Back to humble pie for me grandma.

In addition to battle tested methods of meantrade, I have always been focused on finding a way to trade ORB (opening range) breakouts on the same chart as reversals. I finally discovered that using a trailing indicator such as the cci, stochastics or rsi on a larger time frame as a directional indicator of the current market (yes, still a lagging metric but trends tend to persist in forex for at least a few hours which is all I need to take profits on a weekly basis) creates very robust breakout trading opportunities on my constant range charts. I have been using 10 pip ranges for both my EUR/USD and GBP/USD charts as of late as I find the market is as whippy as ever and the 20 crb's were giving back far too many pips.
I am now taking the pre-London range as my two trade levels (long and short). I only trade in the direction of the 4 hour indicator (in this case the 4hr reading of the CCI should be above the 0 level). The results are not bad. With this method it enables two trade opportunities per market per day. If the market breaks out I can enter at first break and if it pulls back to a trade level I am watching, I can enter for a nice reversion trade. Now I have both sides of a good market on my radar and on the same chart. This is somewhat encouraging for me as I was often sitting staring at the screen waiting for a meantrades setup to occur while the market just takes off without any retrenchments. Not a particularly useful way to trade the forex market these days.

So I will take this massive hiccup in stride. I will stay the course, I won't take this as an indication that I have failed once again. But a very sound reminder that I have a decent system, which works but requires that I take my medicine. And everyone knows a traders medicine is their stop loss.
Sunday, March 25, 2012
Negative excursion volatility based stops
Over the past few months I have begun to employ more and more traditional price based stops. The beginning of this year found meantrades reaching into drawdowns which I was not that comfortable trading with. Taking hard stops and walking away for the day is tough in any system but when applying it to a mean reversion system it means you are inevitably getting stopped out just before the market turns.
Since employing supertrend volatility metrics I realized that there is a remarkably consistent pattern occuring between price action and the ATR based indicator popularly known as supertrend. When the market reverses and the signal is created in the meantrades system very often if the market does not take off in the expected direction it will pasue for a while and then resume the expected direction. However if it doesn't it will accelerate resuming the trend creating a negative excursion for meantrades. This is ok, I have always dealt with this and will continue to do so. But the beauty of supertrend is that it allows you a chance to observe price action and its commitment for continuation or mean reversion.
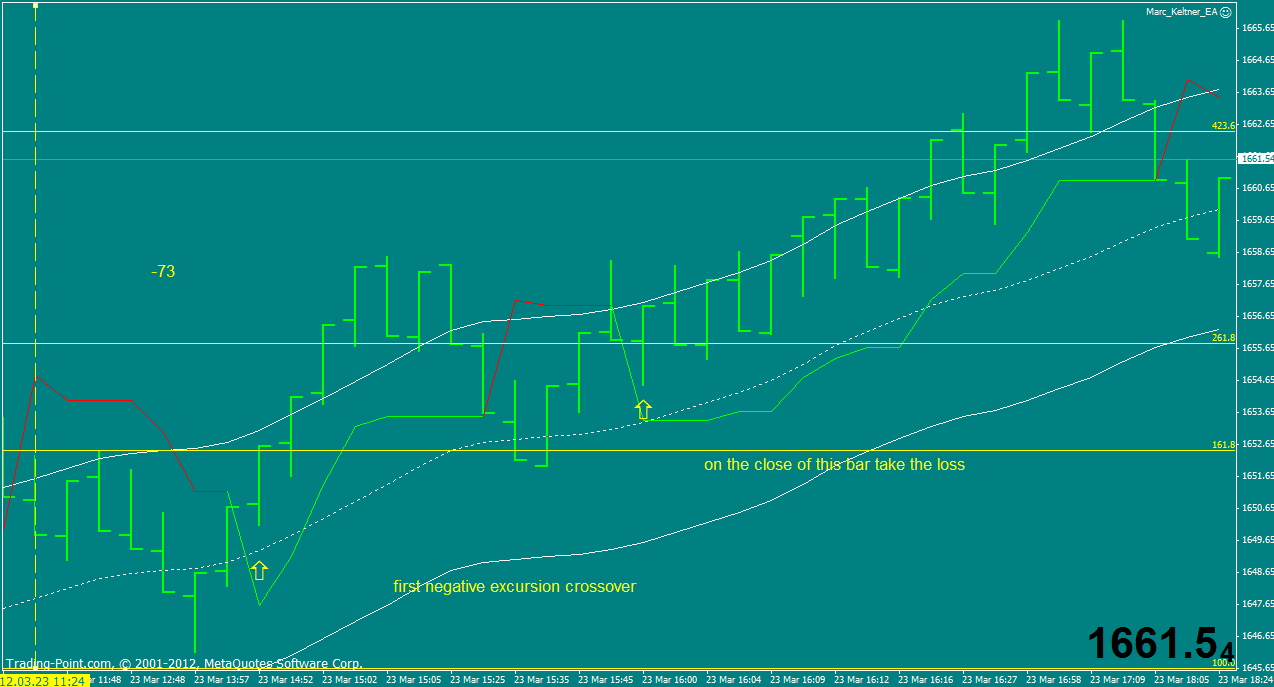
So I'm adjusting my stop method slightly again. Instead of taking the swing high or low I will employ the supertrend crossover on its second negative excursion.
You can see in the screenshot below that a signal was generated at 11:24 and then the market resumed its uptrend. Once more the market began to revert to its mean however it could not reverse as anticipated so a stop was taken on the second supertrend crossover to the upside. Notice that the stop taken is actually lower than the swing high--where we have been taking stops for the past few months.

This stop method does have an unpleasant downside. You cannot know exactly where you will stop out before you enter the trade. However taking the observations of legendary traders who have come before me as dogma, it has been said time and time again, markets revert to their mean, even on a fractal level and thus for every larger stop painfully absorbed, there will be many smaller stops which create more meantrades alpha in a longer data set. Markets will always seek the most viscous point to move towards in order to damn the largest amount of traders in the market. By employing a volatility based stop which assumes markets will revert on every level of price action, stops should see a positive reduction in end of day balance draw-downs. However this means intraday account balances will almost certainly increase.
Employing this stop revision, results from the 3rd week in March have been encouraging.
EUR 3/19-3/23: +160
GBP 3/19-3/23: +47
XAU 3/19-3/23: +184 (this includes the stop posted above on Friday's trade)
Since employing supertrend volatility metrics I realized that there is a remarkably consistent pattern occuring between price action and the ATR based indicator popularly known as supertrend. When the market reverses and the signal is created in the meantrades system very often if the market does not take off in the expected direction it will pasue for a while and then resume the expected direction. However if it doesn't it will accelerate resuming the trend creating a negative excursion for meantrades. This is ok, I have always dealt with this and will continue to do so. But the beauty of supertrend is that it allows you a chance to observe price action and its commitment for continuation or mean reversion.
So I'm adjusting my stop method slightly again. Instead of taking the swing high or low I will employ the supertrend crossover on its second negative excursion.
You can see in the screenshot below that a signal was generated at 11:24 and then the market resumed its uptrend. Once more the market began to revert to its mean however it could not reverse as anticipated so a stop was taken on the second supertrend crossover to the upside. Notice that the stop taken is actually lower than the swing high--where we have been taking stops for the past few months.
This stop method does have an unpleasant downside. You cannot know exactly where you will stop out before you enter the trade. However taking the observations of legendary traders who have come before me as dogma, it has been said time and time again, markets revert to their mean, even on a fractal level and thus for every larger stop painfully absorbed, there will be many smaller stops which create more meantrades alpha in a longer data set. Markets will always seek the most viscous point to move towards in order to damn the largest amount of traders in the market. By employing a volatility based stop which assumes markets will revert on every level of price action, stops should see a positive reduction in end of day balance draw-downs. However this means intraday account balances will almost certainly increase.
Employing this stop revision, results from the 3rd week in March have been encouraging.
EUR 3/19-3/23: +160
GBP 3/19-3/23: +47
XAU 3/19-3/23: +184 (this includes the stop posted above on Friday's trade)
Sunday, November 20, 2011
OHLC is just a line in the sand for Support and Resistance
In spite of my interest in OHLC, there are plenty of other ways to create very clear and potent daily levels of support and resistance within the meantrades method.
Let's compare several of them and see the results from last week.
Using 10 pip CRB's we can track the progress of each method of Support and Resistance. It's starting to become fairly obvious that no matter how to create your "line in the sand" on your chart, every day the results will vary. Thus, for posterity's sake, let's compare the results. Keep in mind when we look at historical trades, we are very mechanical in our entry, although in real-time you can be less so, taking into account the velocity of the markets (the rate of bar change) to help you decide if one of the primary rules of meantrade could be overlooked for the sake of a great risk to reward setup. For example, perhaps price has already violated the keltner midpoint and you still want to take the reversal from the S/R level. There are so many good trades which don't set up perfectly. This requires a traders vision and resourcefulness and is the reason most great mechanical systems cannot be hardcoded into a black box to ride off into the sunset and make us all millionaires in a month.
Traditional Pivot points (using the daily close at 5pm as the starting point for daily calculation):

11/14-11/19, Keltner touch exit: +30
11/14-11/19, Supertrend exit (note: when using the supertrend exit, we move stops to break even once we touch the opposite keltner band from entry, it creates a high percentage of break even stop outs, but allows for a few really big wins throughout the trading week): +31
Fibonacci Levels based on the first High Low close of the day:
(One of the true benefits of this method of creating intra-day S/R is that it does not have levels after the market breaks out, in a sense, it only looks for reversals within the expected daily range)
11/14-11/19, keltner touch exit: -28
11/14-11/19, supertrend exit: +102

With this method we also have the option of trading with the trend only after price has broken the last fib extension level. As you can see in the screenshot above, this creates some very high probability setups.
ORB Fib levels based on Asian session range:
11/14-11/19, keltner touch exit: +87
11/14-11/19, supertrend exit: +114
Finally, OHLC levels:
11/14-11/19, keltner touch exit: +51
11/14-11/19, supertrend exit: +114
Quite interesting that the OHLC S/R levels performed exactly the same as the ORB Fib levels. Fine with me, it proves Meantrades was ok the way it is originally. I like having that validation. Most people in back-testing circles refer to that mental condition as positive expectancy. With positive expectancy we can take every signal without trepidation.
One more method for creating S/R levels I learned from a guy on elite trader a long time ago who claimed, with about 5 years of trading futures under his belt by this time, that if you adjusted your fib ratios to 3.77, 5.12 and 7.80 instead of the standard, 1.618, 2.618 and 4.236, you would have more accurate targets for the daily range. I tested it a while back and it was true...sometimes!
If we take the opening range and use these ratios, as well as high low and 50% of the ORB and then applied these ratios for last weeks trading this is what happens:
11/14-11/19, keltner touch exit: +113
11/14-11/19, supertrend exit: +206
Looks like a winner.

Keep in mind that this is based on a single brokers data. Your results will certainly vary. In fact, I invite anyone to get in touch with me on yahoo at "mezarashii" and I would be happy to teach you how to set up your charts to get you going on meantrades..., well, I'm not sure what we should call the last method of creating S/R levels. I'm open for suggestions.
So what did I discover here in the end. Almost certainly pivots are a waste of time when trading horizontal support and resistance levels. But then, this I knew for years. I'm not sure why it does not work in forex but I'm assuming it has a lot to do from what time you plot them and the end of trading for one market is not the end for another. Perhaps re-plotting based on the opening price of each market would yield more active S/R lines but at this point I will leave that discovery to someone else. I prefer ratios and you can see why with the results from last week. Imagine getting a yield like that week in and week out. Most of these winning trades came on 2 or 3 days only. The beginning of the week was a real dud and sitting on a negative balance was quite challenging. But with positive expectancy, you can continue to pull the trigger with total confidence. That is what I took from this weekend analysis.
Let's compare several of them and see the results from last week.
Using 10 pip CRB's we can track the progress of each method of Support and Resistance. It's starting to become fairly obvious that no matter how to create your "line in the sand" on your chart, every day the results will vary. Thus, for posterity's sake, let's compare the results. Keep in mind when we look at historical trades, we are very mechanical in our entry, although in real-time you can be less so, taking into account the velocity of the markets (the rate of bar change) to help you decide if one of the primary rules of meantrade could be overlooked for the sake of a great risk to reward setup. For example, perhaps price has already violated the keltner midpoint and you still want to take the reversal from the S/R level. There are so many good trades which don't set up perfectly. This requires a traders vision and resourcefulness and is the reason most great mechanical systems cannot be hardcoded into a black box to ride off into the sunset and make us all millionaires in a month.
Traditional Pivot points (using the daily close at 5pm as the starting point for daily calculation):

11/14-11/19, Keltner touch exit: +30
11/14-11/19, Supertrend exit (note: when using the supertrend exit, we move stops to break even once we touch the opposite keltner band from entry, it creates a high percentage of break even stop outs, but allows for a few really big wins throughout the trading week): +31
Fibonacci Levels based on the first High Low close of the day:
(One of the true benefits of this method of creating intra-day S/R is that it does not have levels after the market breaks out, in a sense, it only looks for reversals within the expected daily range)
11/14-11/19, keltner touch exit: -28
11/14-11/19, supertrend exit: +102

With this method we also have the option of trading with the trend only after price has broken the last fib extension level. As you can see in the screenshot above, this creates some very high probability setups.
ORB Fib levels based on Asian session range:
11/14-11/19, keltner touch exit: +87
11/14-11/19, supertrend exit: +114
Finally, OHLC levels:
11/14-11/19, keltner touch exit: +51
11/14-11/19, supertrend exit: +114
Quite interesting that the OHLC S/R levels performed exactly the same as the ORB Fib levels. Fine with me, it proves Meantrades was ok the way it is originally. I like having that validation. Most people in back-testing circles refer to that mental condition as positive expectancy. With positive expectancy we can take every signal without trepidation.
One more method for creating S/R levels I learned from a guy on elite trader a long time ago who claimed, with about 5 years of trading futures under his belt by this time, that if you adjusted your fib ratios to 3.77, 5.12 and 7.80 instead of the standard, 1.618, 2.618 and 4.236, you would have more accurate targets for the daily range. I tested it a while back and it was true...sometimes!
If we take the opening range and use these ratios, as well as high low and 50% of the ORB and then applied these ratios for last weeks trading this is what happens:
11/14-11/19, keltner touch exit: +113
11/14-11/19, supertrend exit: +206
Looks like a winner.

Keep in mind that this is based on a single brokers data. Your results will certainly vary. In fact, I invite anyone to get in touch with me on yahoo at "mezarashii" and I would be happy to teach you how to set up your charts to get you going on meantrades..., well, I'm not sure what we should call the last method of creating S/R levels. I'm open for suggestions.
So what did I discover here in the end. Almost certainly pivots are a waste of time when trading horizontal support and resistance levels. But then, this I knew for years. I'm not sure why it does not work in forex but I'm assuming it has a lot to do from what time you plot them and the end of trading for one market is not the end for another. Perhaps re-plotting based on the opening price of each market would yield more active S/R lines but at this point I will leave that discovery to someone else. I prefer ratios and you can see why with the results from last week. Imagine getting a yield like that week in and week out. Most of these winning trades came on 2 or 3 days only. The beginning of the week was a real dud and sitting on a negative balance was quite challenging. But with positive expectancy, you can continue to pull the trigger with total confidence. That is what I took from this weekend analysis.
Wednesday, November 16, 2011
Meantrades OHLC a deeper understanding...
My objective with altering the Support and Resistance levels to OHLC with Meantrades is to refine an already useful concept. The less trade points we have an opportunity to trade, the more likely we are to execute according to plan. Of course the assumed premise is that the system has a positive expectancy.
Meantrades, regardless of how the support and resistance lines are formed, no matter what the time frame, has a positive expectancy. The only question in my mind has always been drawdowns. OHLC seems to create a more significant way to enter the market and reduce risk.
Yesterday there was 3 trades in 4 markets I follow. EURUSD went for a loss, Oil had a break even stop, as did YM index. With intervention both Oil went for 40 points as did the YM. The EURUSD loss was -37 pips. In the previous stop method of meantrades, the EURUSD trade would still be short and sitting on a drawdown of about 150 pips this morning. Nothing to panic about, but with volatility at an all time high, there will come a day in the not too distant future where the maximum negative excursion will be so large, no account size can handle it. I hate hard stops, but I hate margin calls even more.

OHLC will always be used with modified price bars. Originally I saw the value of constant range bars with their ability to remain in trends longer. These days, it is more about reducing risk. If you were to compare a stop loss on a time based price candle, there is no way to know truly how large it will get before its close. Fast markets create larger candles. With constant range bars, fast candles are always the same size. Compare these two losing trades to see what I mean:


Here we can see with CRBs we reduced the stop loss not only in amount of pips but we were able to see that the market had violated its stop level much earlier than with the conventional time based chart.
To recap what Meantrades actually comprises:
- Keltner bands:
We must have a Keltner band touch of the outer band in the opposite direction of the trend. We don't want to be trading support and resistance without a healthy amount of momentum in either direction. If a market is simply climbing the wall of worry, there is no place to be looking for reversals. It is much better to be with the trend at that point as it will eventually climax and present a better reversal trade opportunity at some later point.
2 possible Keltner band setups:
- Market has a strong breakout outside the Keltner bands and then reverses.

2. Market trades outside the Keltner but has no thrust higher. This is a slightly lower percentage scenario than #1 but nonetheless still a statistically significant trade setup. Often this trade can turn into a creeping market where it never has any thrust higher but still takes out stops.

Saturday, October 15, 2011
Trend Trade
Ok so I went evangelical last week and made a fool of myself without posting any proof that I have been, yes, trend trading.
So here it is. The newest intraday trend method.
Pay close attention because this is a pretty powerful method.
First and foremost, you have to trade with constant range bars. Do not even think that this will work as well on a standard intraday chart. You will get chopped to bits and blast me as a system serialist. Which I probably am, but this is really not the case this time.
Second you need two ways to mark the intermediate trend. I have chosen Supertrend and a rather quirky rsi like indicator named after its creator the YangTraderMain.
The settings I use on the constant range bars are based on a 24 hour ADR rating (Average daily range). For example, EUR/GBP had a range of about 97 pips yesterday. if you divide 97 by 24 you get almost 5 pips an hour. So I would trade EUR/GBP with 5 pip constant range bar.
The settings on Supertrend are 10 period and the multiplier 1.5. This is very similar to an ATR rating but there is some updated voodoo. This is probably one of the most popular revisions on the moving average crossover because it integrates the crossover with a measure of volatility. Which is pretty much the foundation for robust trend trading methods.
The bars should be set on OHLC not candlestick. This is extremely important to determine entry and stops. The stop method employed here is a huge advantage over any other stop method I have attempted before.
Since it's so important, let's start with stops then.
Take the swing high prior to the signal and place a horizontal line 1 pip beyond this level. If price trades at this level AND BEYOND. Do not exit. Not yet. Wait. Yes, wait. Wait for a OHLC bar to CLOSE outside this horizontal line. Occasionally a bar will OPEN outside this level but it will trade back into the range. This is the precisely why this stop method is so useful. It allows you to take a slightly larger loss by waiting to see if the market makers are simply blowing stops and mean reverting or if the market has really broken out. I should mention that this stop method is extremely risky using time based bars. A close of a time based bar gives you no measure of volatility. A 5 minute bar could be 1 pip or, as in the case of EUR/CHF a few weeks ago HUNDREDS!
Entries are a much tamer affair and probably familiar to most trend traders. Price should close in the direction of the Supertrend indicator. The price bar should also close in the direction of the supertrend. In addition, the yang trader must be signalling with the trend as well.
I particularly like the staggered effect that Yang trader creates. There are quite a few signals which you should not even consider taking. Think of them more like a divergence indicator than a directional indicator. Once all 3 of these factors are in sync, a trade should be entered.
Now, normally we would use targets. But with trend trading, there are so many reasons why we shouldn't trade in this manner. There is just so much profit to be made in the trades you EXPECT to reverse at 20 pips and they drip drip drrrrrrrrrrrrrrip on for another 100 leaving you to do nothing but bank pips the whole session. This is the ONLY part of trading which gives you an edge. Predictive methods just cannot compare to this kind of trading. They will lose over the long term if left on their own. I should mention something that I have felt for quite a while. I honestly believe Fibonacci, Gann, MurreyMath, Astrology, etc. work well. BUT they do not work because of some secret order to the universe. They simply work for the same reason that trend trading fails for short periods of time. Markets revert to the mean. Randomly mark horizontal lines on a chart and trade your method based on them. I have discovered that for a short period of time, they will outperform almost any world famous support and resistance level. This includes daily pivot points. This is not a knock on support and resistance trading, it is just a fact and it still justifies trading in this method, but trend trading just makes more money over the long term.
So we trail our entries.
The trailing stop, at least for now, until I find something more ideal, will be the pip difference between the swing high and the entry.
That's it.
I would recommend you trade the less volatile pairs at the beginning. This system needs to be watched for the stops as we cannot enter a firm price in the market. But once you are in profit, just walk away and wait for the next Supertrend crossover.
This week profits have been good if not great. I made about 350 pips on 4 pairs. Maximum price excursion was running at about 45% of gains. That is, prices went against me about half as much as profits. This is primarily due to a few big trends on Monday. I would expect this to revert more towards a negative mean over time. Mainly because we are trailing exits. The frequency of small gains will outweigh the occasional meaty loss.
Good trading.
So here it is. The newest intraday trend method.
Pay close attention because this is a pretty powerful method.
First and foremost, you have to trade with constant range bars. Do not even think that this will work as well on a standard intraday chart. You will get chopped to bits and blast me as a system serialist. Which I probably am, but this is really not the case this time.
Second you need two ways to mark the intermediate trend. I have chosen Supertrend and a rather quirky rsi like indicator named after its creator the YangTraderMain.
The settings I use on the constant range bars are based on a 24 hour ADR rating (Average daily range). For example, EUR/GBP had a range of about 97 pips yesterday. if you divide 97 by 24 you get almost 5 pips an hour. So I would trade EUR/GBP with 5 pip constant range bar.
The settings on Supertrend are 10 period and the multiplier 1.5. This is very similar to an ATR rating but there is some updated voodoo. This is probably one of the most popular revisions on the moving average crossover because it integrates the crossover with a measure of volatility. Which is pretty much the foundation for robust trend trading methods.
The bars should be set on OHLC not candlestick. This is extremely important to determine entry and stops. The stop method employed here is a huge advantage over any other stop method I have attempted before.
Since it's so important, let's start with stops then.
Take the swing high prior to the signal and place a horizontal line 1 pip beyond this level. If price trades at this level AND BEYOND. Do not exit. Not yet. Wait. Yes, wait. Wait for a OHLC bar to CLOSE outside this horizontal line. Occasionally a bar will OPEN outside this level but it will trade back into the range. This is the precisely why this stop method is so useful. It allows you to take a slightly larger loss by waiting to see if the market makers are simply blowing stops and mean reverting or if the market has really broken out. I should mention that this stop method is extremely risky using time based bars. A close of a time based bar gives you no measure of volatility. A 5 minute bar could be 1 pip or, as in the case of EUR/CHF a few weeks ago HUNDREDS!
 |
| This is only a few trades. I still cannot get over how well AUD/JPY trends. The range is phenomenal. Yesterday it signaled for more than 175 pips and still going. Sweet Moses! |
Entries are a much tamer affair and probably familiar to most trend traders. Price should close in the direction of the Supertrend indicator. The price bar should also close in the direction of the supertrend. In addition, the yang trader must be signalling with the trend as well.
I particularly like the staggered effect that Yang trader creates. There are quite a few signals which you should not even consider taking. Think of them more like a divergence indicator than a directional indicator. Once all 3 of these factors are in sync, a trade should be entered.
Now, normally we would use targets. But with trend trading, there are so many reasons why we shouldn't trade in this manner. There is just so much profit to be made in the trades you EXPECT to reverse at 20 pips and they drip drip drrrrrrrrrrrrrrip on for another 100 leaving you to do nothing but bank pips the whole session. This is the ONLY part of trading which gives you an edge. Predictive methods just cannot compare to this kind of trading. They will lose over the long term if left on their own. I should mention something that I have felt for quite a while. I honestly believe Fibonacci, Gann, MurreyMath, Astrology, etc. work well. BUT they do not work because of some secret order to the universe. They simply work for the same reason that trend trading fails for short periods of time. Markets revert to the mean. Randomly mark horizontal lines on a chart and trade your method based on them. I have discovered that for a short period of time, they will outperform almost any world famous support and resistance level. This includes daily pivot points. This is not a knock on support and resistance trading, it is just a fact and it still justifies trading in this method, but trend trading just makes more money over the long term.
So we trail our entries.
The trailing stop, at least for now, until I find something more ideal, will be the pip difference between the swing high and the entry.
That's it.
I would recommend you trade the less volatile pairs at the beginning. This system needs to be watched for the stops as we cannot enter a firm price in the market. But once you are in profit, just walk away and wait for the next Supertrend crossover.
This week profits have been good if not great. I made about 350 pips on 4 pairs. Maximum price excursion was running at about 45% of gains. That is, prices went against me about half as much as profits. This is primarily due to a few big trends on Monday. I would expect this to revert more towards a negative mean over time. Mainly because we are trailing exits. The frequency of small gains will outweigh the occasional meaty loss.
Good trading.
Subscribe to:
Posts (Atom)